

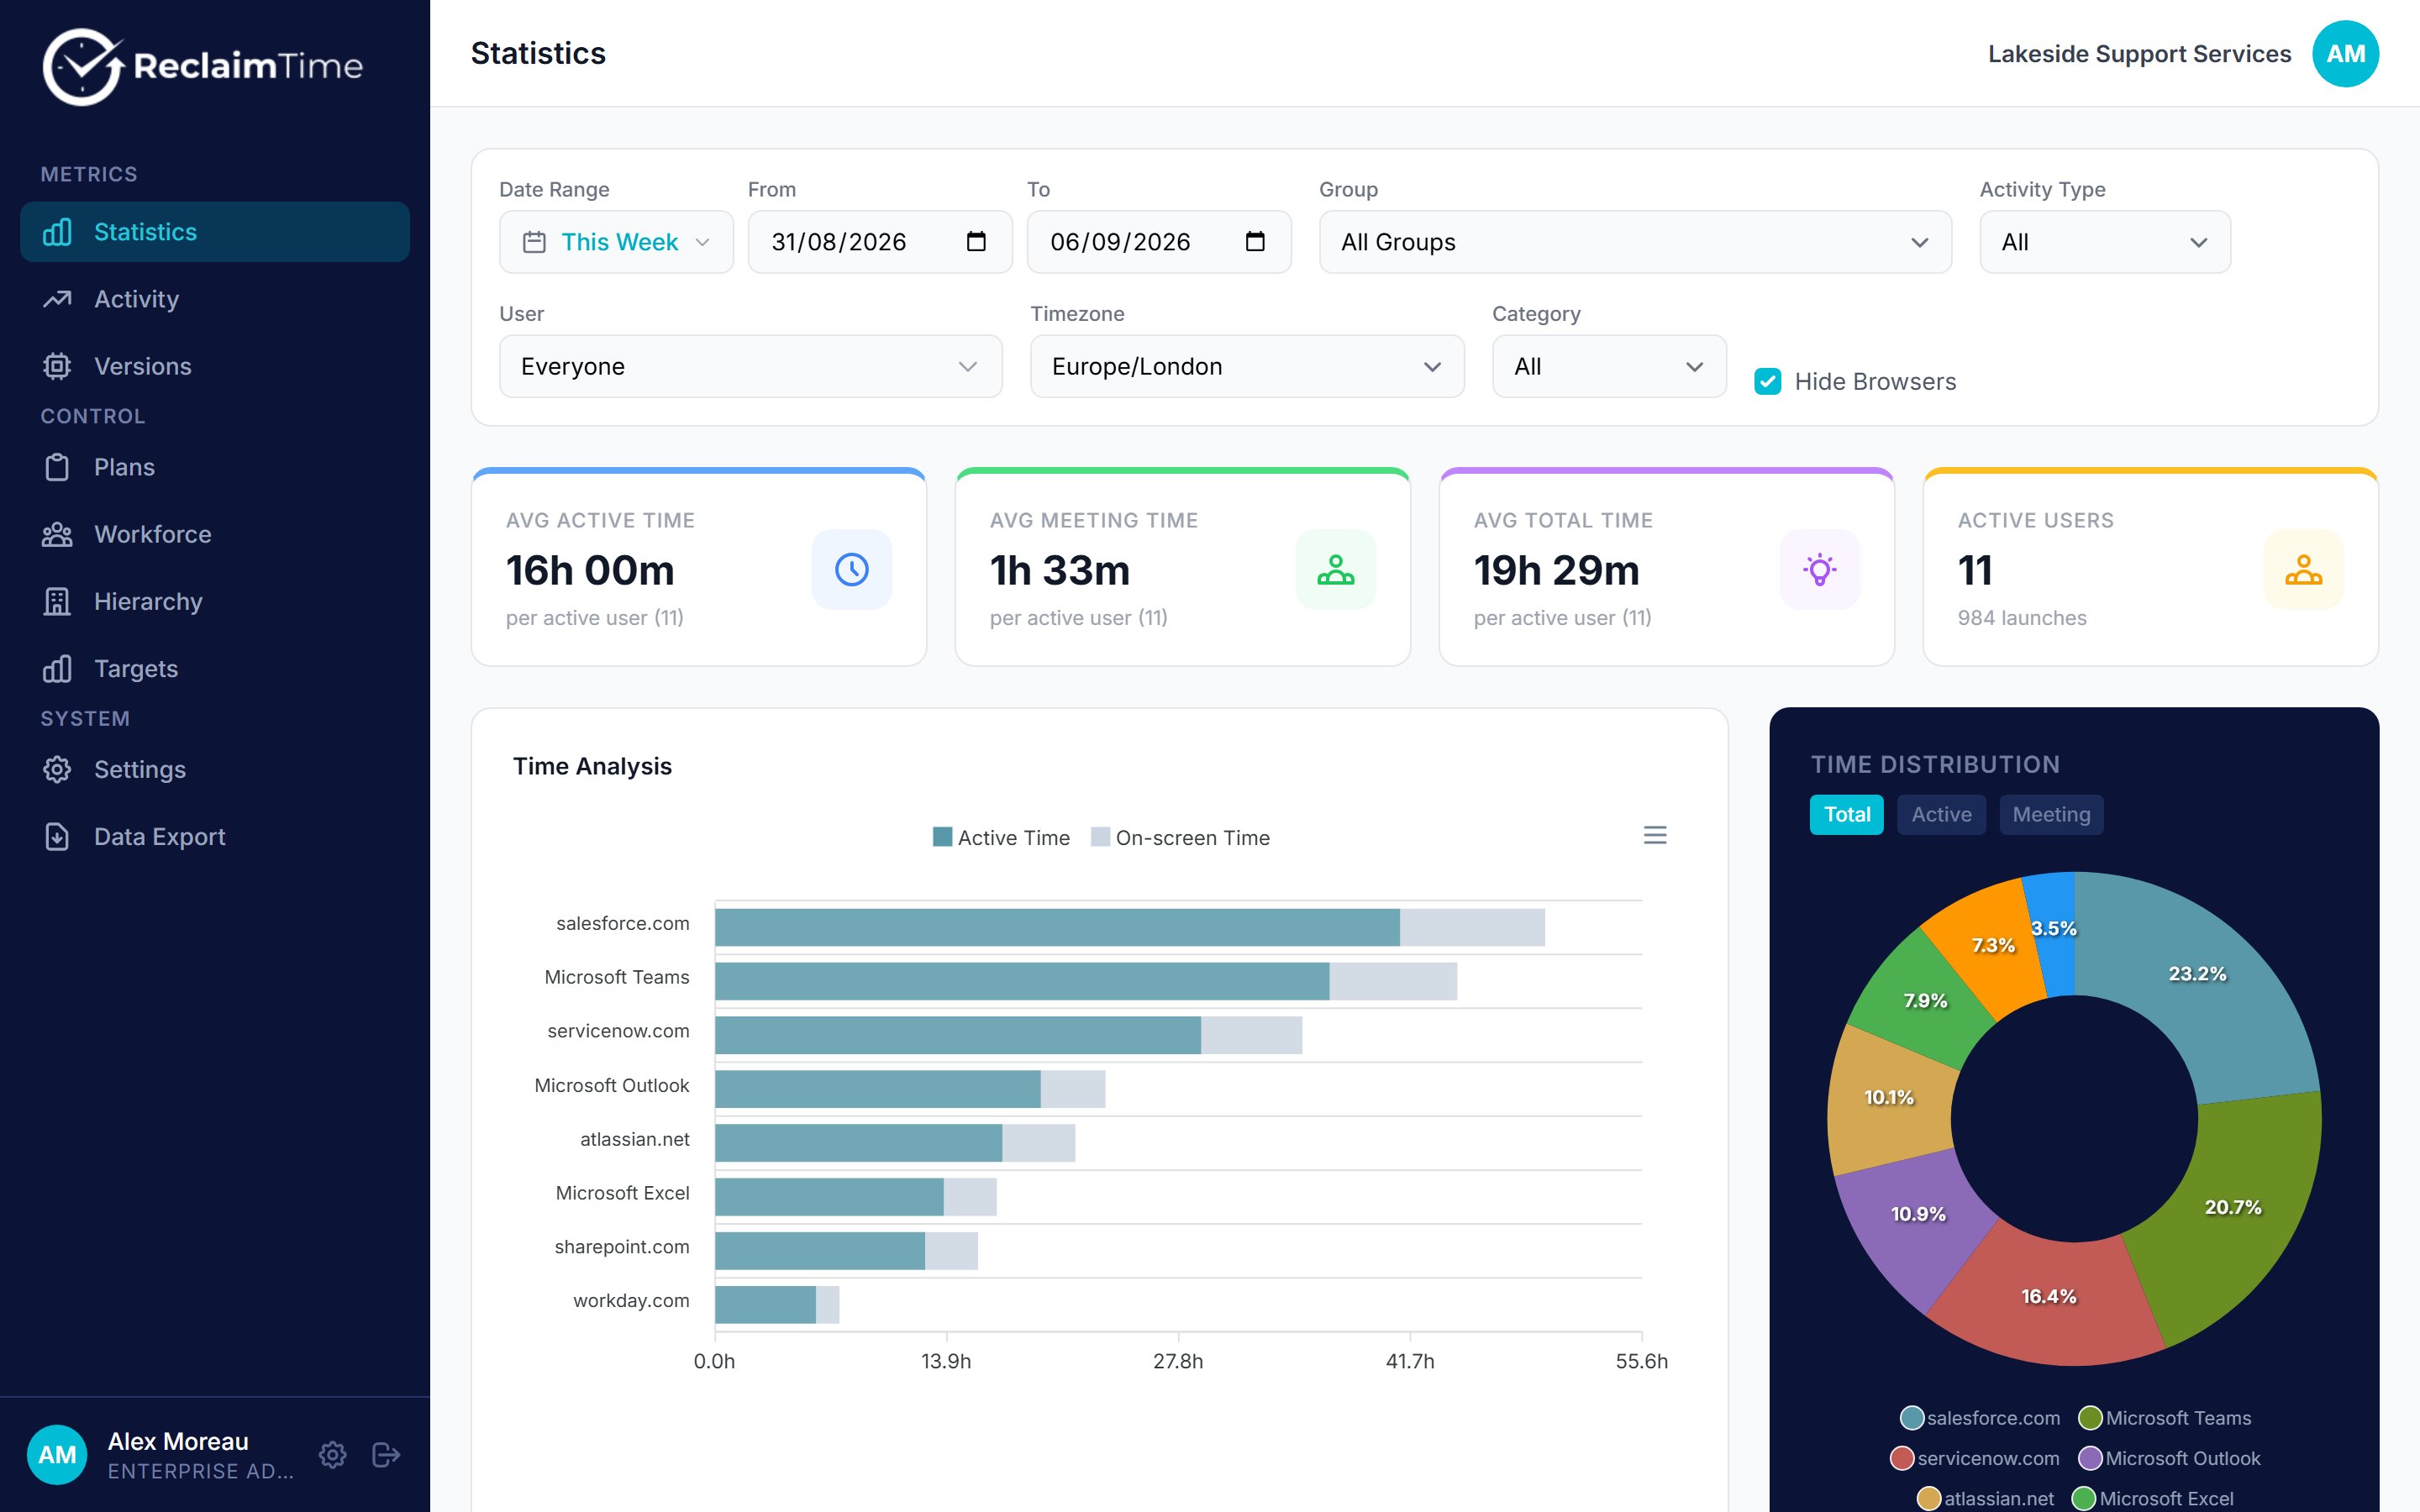
Statistics for the whole organisation over one week
Filters
The four cards
All four are per active user, not team totals. The count in brackets is how many people that average is over.Read Active users first. An average over 7 people when the team has 12 is a different number from an average over 12, and the page does not warn you.
Charts and the table
Time Analysis ranks applications and websites by active time, with on-screen time shown behind it, so a passive window on a second monitor is visible as the gap between the two bars. Time Distribution is the same data as a share of the total, switchable between Total, Active and Meeting. Below them, a per-user table breaks the same period down by person.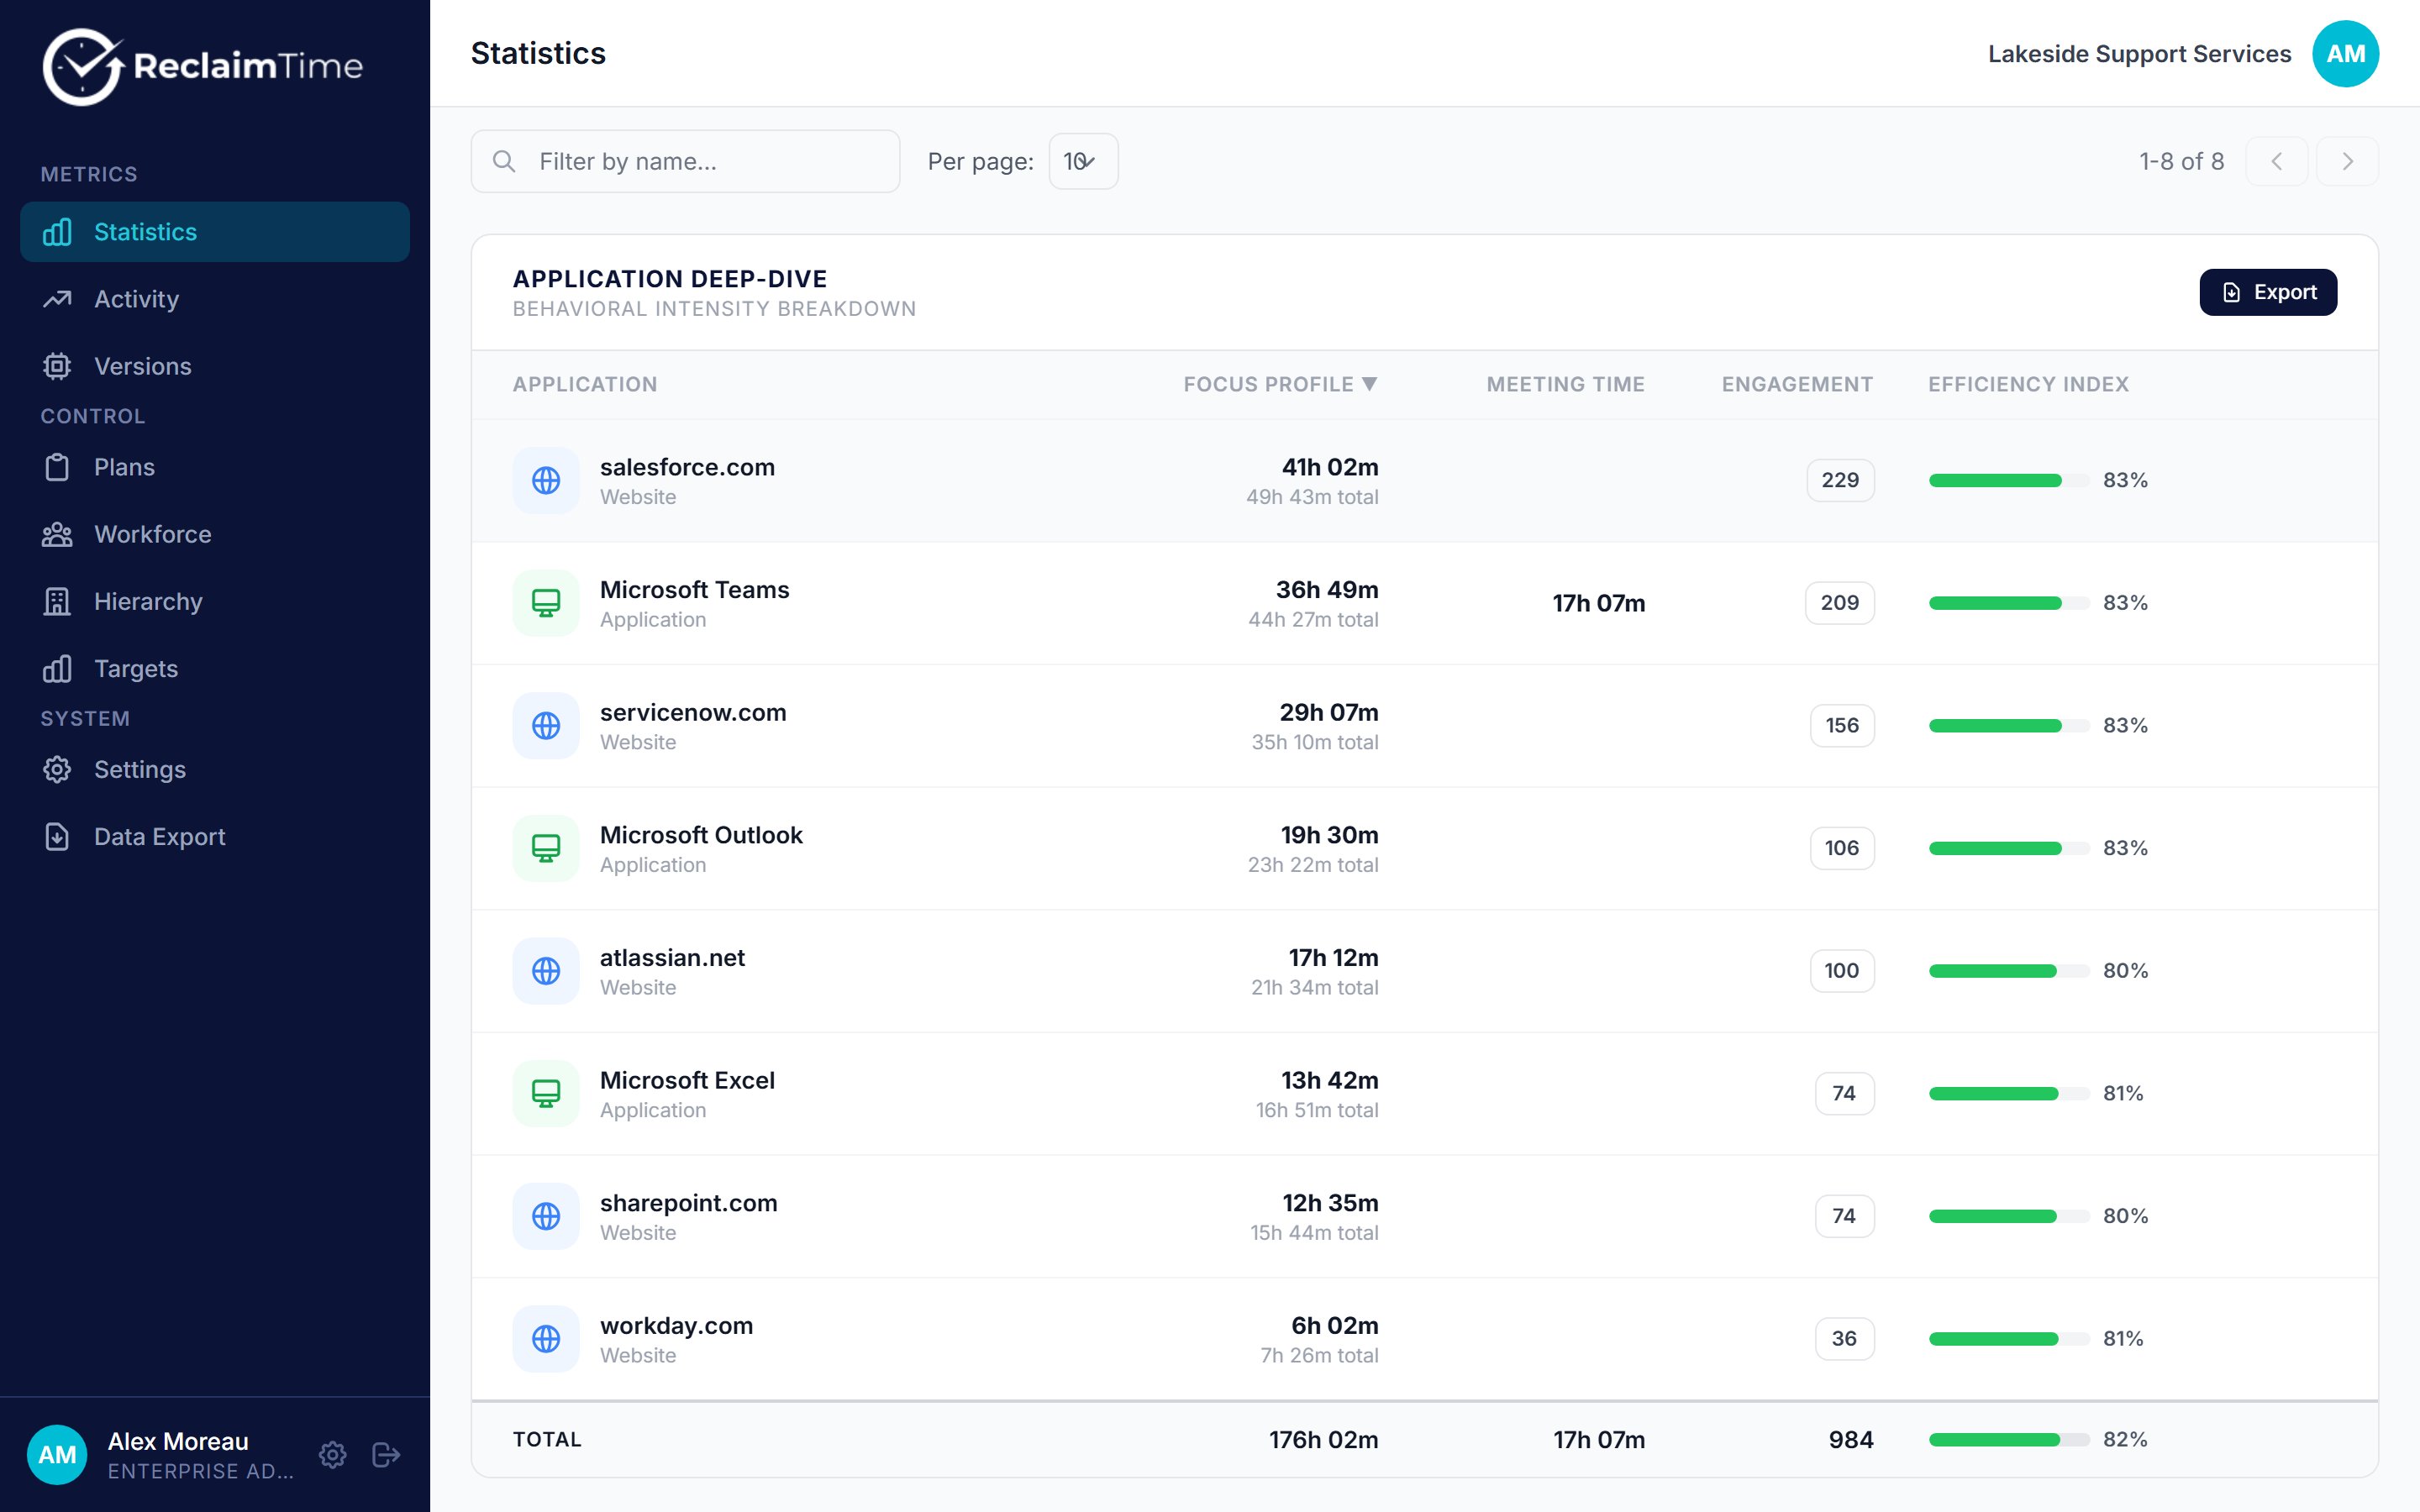
The per-user breakdown below the charts
Corporate and non-corporate
This is the filter people misread most often, so it is worth being precise.- Corporate shows the rows that carry a username: work applications and the sites on your corporate list. You can filter these to one person.
- Non-Corporate shows the rows that do not carry a username, because the application or site is not on the corporate list. They are grouped by team instead, so you can see how much time a team spent off work targets without seeing who.
- All adds the two together.
Exporting
The CSV export gives you the applications and websites table for the current filters. For raw per-session rows across a longer period, use Data export instead.Reading it fairly
- A softphone that ReclaimTime does not recognise as a meeting counts as active time in that application, not as meeting time. A team that lives on the phone will look different from one that lives in Teams.
- Time is not output. Two people on the same queue can differ by a factor of two on case complexity alone.
- A short period exaggerates everything. One person’s day off moves a weekly average noticeably in a team of eight.
Related tasks
Checked against ReclaimTime client 8.0.0.9 and dashboard V3 on 5 September 2026.